Mirovα, Creating Sustainable Value - May 2024
Monthly market review and outlook

Understanding all the nuances of events in April
After an exceptional end to the first quarter for risky assets, April began with some profit-taking before subsequently recovering. During the first fortnight, the Nasdaq and Nikkei corrected by around 10%1and the European indices by around 3%1against a backdrop of outperformance by defensive stocks.
The high valuation multiples of certain market segments and the excessive positioning of investors at the end of March can only partly explain this change in tone. In the first part of the month, geopolitical tensions flared up again, with Iran's first direct attack on Israel on 13 April. This pushed oil prices up to $92 a barrel1 and fuelled a rise in interest rates, stagflationary fears and a return to risk aversion. The VIX, the implied volatility index for US equities, made a quick foray above the 20% threshold 1 in the middle of the month. Tensions then eased, allowing the Brent crude oil price to end April at $881.
The second half of the month was more constructive, with European and US equities down by around -1.5% and -4.5%1 respectively over April, thanks to robust economic growth and corporate earnings.
Companies have presented their quarterly figures and on average, EPS2 significantly exceeded consensus. On both sides of the Atlantic, the leaders are delivering, led by technology in the US, while in Europe banks and insurance are demonstrating their solidity and defensive sectors are doing better than expected, notably pharmaceuticals and consumer staples. This quarter also saw a broadening of positive earnings revisions across all sectors, as well as an improvement in margins.
Moreover European investors warmly welcomed the latest PMI Services survey data, now in line with expanding activity, and stronger-than-expected GDP growth3 in the first quarter, confirming that Europe is well on the road to recovery. Growth reached +0.3%1 q/q4 versus +0.1%1. In the United Kingdom, it was +0.6% q/q1 compared with 0.4%1. Consumer confidence improved again in April, albeit at a slow pace. In other good news, headline inflation remained stable at 2.4%1 y/y 5 in April in the eurozone, while core inflation continued to slow, from 2.9%1 to 2.7%1, in line with expectations.
In the United States, although domestic demand remains vigorous, rising by 0.7%1 in April and 3%1 in Q1, there was a slight deterioration in the growth/inflation mix. The first GDP estimate came in at 1.6%1 q/q, below the 2.5%1 expected and the 3.4%1 of the previous quarter, while inflation figures are no longer falling, at 0.4%1 for April, compared with the 0.3%1 expected, thus remaining at the same level for the third consecutive month. Over the year, CPI6 inflation stood at 3.8% and the core PCE index at 2.8%, still above the Federal Reserve's target.
Quite logically, the ECB decided to keep interest rates unchanged at its last meeting, citing a lack of significant progress in the fight against inflation, while ruling out the possibility of an interest rate hike in the future, a statement that was very popular with investors.
We expect the Fed7 to make one or two rate cuts between now and the end of the year, concentrated after the summer. As for the market, expectations of rate cuts between now and the end of 2024 fell from 67 basis1 points to 27 bp in April, then rebounded to 408 bp9 following the latest job creation figures, which were slightly below expectations.
In Europe, the ECB10 confirmed its optimism, with a first rate cut highly likely on 6 June. Christine Lagarde and her team are confident that inflation will return to 2%11and should therefore take a different path from the Fed. However, investors' average expectations of ECB rate cuts between now and the end of 2024 fell from 89bp11 to 66bp11 during April, thus eliminating a cut.
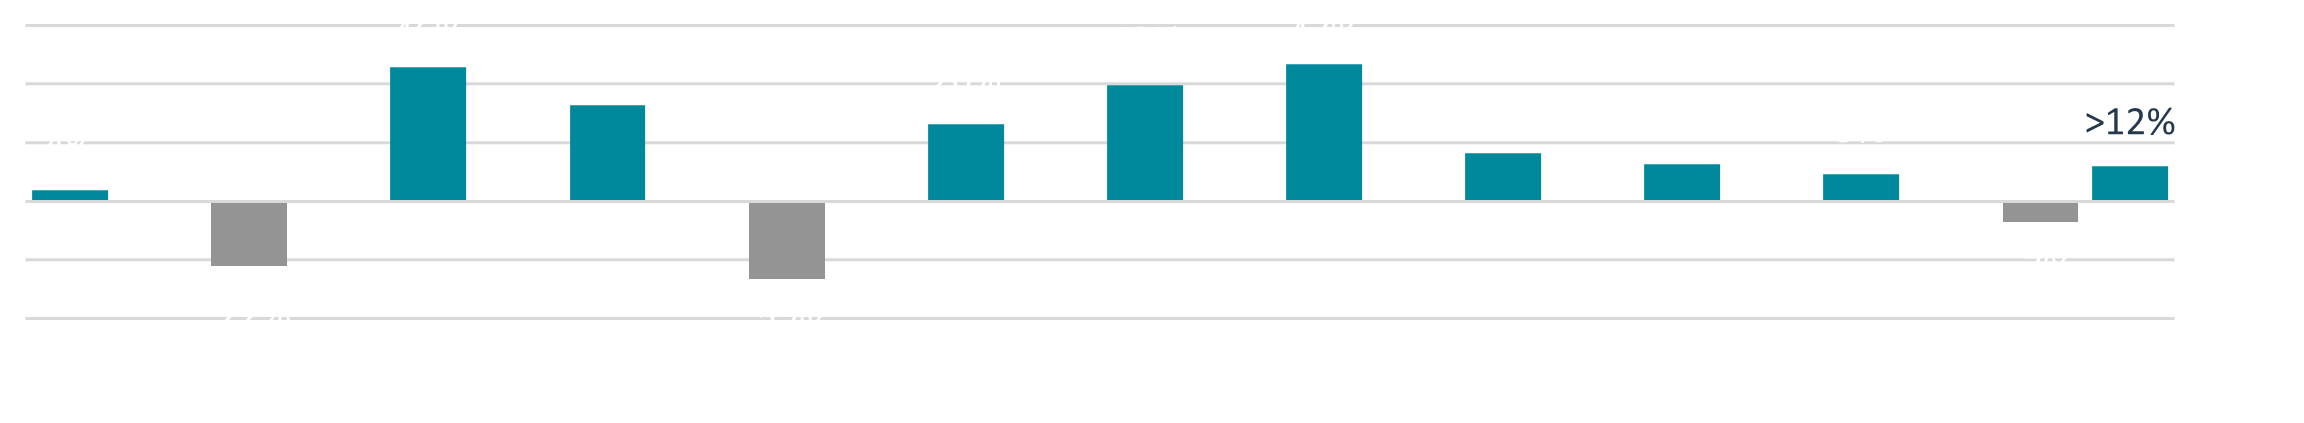
In the end, the German Bund lost 1.8%11, French OATs12 lost 1.5% and Italian BTPs13 lost 1.1%. The biggest fall was in 10-year US Treasury bonds: -2.4%11. Sovereign bond markets thus all fell in unison.
Other notable market movements in April included the sharp fall in bitcoin, which lost around 15%11. Conversely, copper, which is used extensively in the energy transition, gained 14%11, posting its best monthly performance since February 2021, buoyed by an imbalance between supply and demand.
Graph of the month:
risk premium differential in favor of european vs. american equities
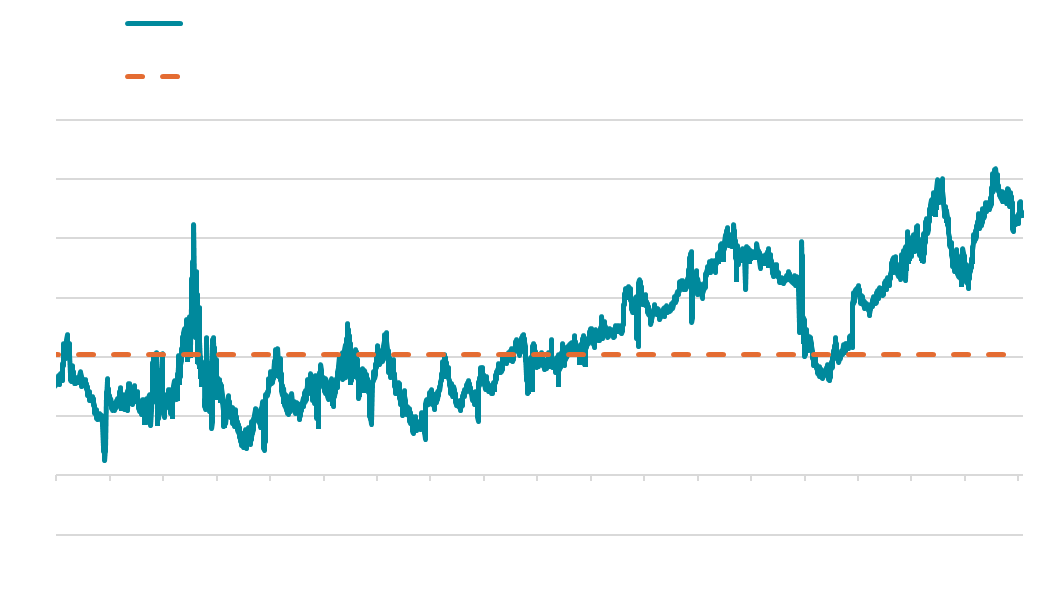
* Equity risk premium based on the difference between the equity earnings yield (1/PE) and the 10-year interest rate
Source: Bloomberg
Macro review and outlook
Solid macroeconomic performance on both sides of the Atlantic
April confirmed our favourable macroeconomic scenario, as demonstrated by forecast and real indicators, particularly in Europe. The Federal Reserve and the ECB14 clarified their policies for the coming months and are unlikely to adopt the same pace for their rate cuts.
United States: the Fed at the helm
In the United States, the Federal Reserve maintained its key rate at 5.5%, 15in the face of disinflation that seems to have paused Following the FOMC meeting16, it is clear that the Bank will not cut rates immediately, adopting a "higher for longer" stance. However, this firmness does not seem to be causing concern on the market, for a number of reasons.
Firstly, fears of an acceleration in job creation leading to an overheating economy seem to have been allayed. The latest figures for April came in below expectations, and estimates for the previous two months were revised downwards. Average hourly earnings rose by 0.2%15, slightly less than the 0.3%15 expected, reducing the year-on-year increase to 3.9%15, compared with 4.1%15 in March. This is the lowest annual increase since June 2021. Average hourly earnings are not the Fed's preferred wage measure, as they are too noisy, but other indicators also point to an easing in wage pressures, notably a fall in the rate of voluntary resignations to below pre-pandemic levels.
Furthermore, the impact of external shocks such as rising oil prices or transport costs seems contained at this stage.
As a result, a large part of the disinflation could now come from the slowdown in rents, which account for over 40%15 of the services price index, and which are likely to fall over the coming months/quarters.
In theory, the halt in disinflation could have raised fears of an interest rate hike, but Jerome Powell seems to have ruled this out at the last meeting. On the contrary, the Fed wants to reduce the pace of quantitative tightening, which the market has taken on board.
As for US consumption, it remains buoyant. US consumers' savings are melting away, particularly those of the most vulnerable households. Nevertheless, rising stock markets and property prices, as well as wage growth that continues to outpace inflation, are giving them a real boost to their purchasing power. For example, retail sales rose in March (and also in April) , bringing the first-quarter increase to almost 3%15 on an annualised basis. In addition, the share of private consumption in GDP over the quarter came in above expectations, demonstrating solid growth. Americans are also benefiting from a dynamic labour market. Job creation, few redundancies, an increase in the number of hours worked and less part-time work than in recent months: the job market data are reassuring.
The areas to watch are real estate and manufacturing. Sales of existing properties are suffering from interest rate levels and residential construction is weakening. Market inventories are rising, but this slowdown could also help to curb inflation. As for the ISM manufacturing index17, it failed to break through the 50-point threshold. The manufacturing sector has been struggling in the US for the past 18 months, with the exception of the automotive and high-tech sectors. Longer periods of high interest rates and a strong dollar could slow the manufacturing recovery in the short term, but low inventories, fiscal stimulus through the CHIPS Act18, the need for housebuilding and an improving supply chain situation should encourage a gradual recovery. So the increase in the 'prices paid' component of the PMI indices is not a cause for concern at the moment; it has more to do with the temporary rise in the price of oil.
Europe: good news on all fronts
With good news and pleasant surprises, the various publications from the eurozone in April were reassuring on all fronts. Although headline inflation remained unchanged at 2.4%19 , core inflation fell, as did services inflation to 3.7% 19, despite being stubbornly stuck at 4%19 for five months, while the economy is finally rebounding after five quarters of stagnation. Real GDP came as a surprise, rising by 0.3%19in the first quarter, raising hopes of annual growth slightly lower than 1%19, well above consensus forecasts at the start of the year.
This combination of factors will allow the ECB to start cutting rates with greater confidence. A fall of 25 basis points in June seems almost certain.
Market confidence also continues to be fuelled by positive publications from all eurozone countries. Germany is emerging from stagnation, with growth of 0.2%19 over the quarter. Exports and construction investment are picking up again, and we expect inflation to fall back below 2%19by the summer. France stood out for its acceleration in household consumption, up by 0.4%19, compared with 0.2%19 in the previous quarter. Growth in Italy and Belgium was 0.3%19and even 0.7%19in Spain and Portugal.
The improvement in the European situation can also be seen in the expansion of the PMI indices for the region, which reached 51.719 points in April for the composite index (compared with 50.3 in March)19, an 11-month high, exceeding that of the United States for the first time in a year. The figure for the services sector is 53.319 . France is at around 50, a threshold finally crossed by Germany, after nine months stuck below it. Southern Europe's momentum continues, with solid figures.
Another positive point is that the job market is doing well. Services are continuing to create jobs, and job cuts in manufacturing are slowing. Europeans are benefiting from an increase in foreign demand, which is boosting exports and supporting employment and real incomes. Finally, the black spots in the European economy - construction and property - could soon benefit from an easing of financing terms. All these data support the assumption of a rate cut in early June.
UK: A catch-up is in sight
Having underperformed the US and the eurozone since the start of the pandemic, with the decline deeper in 2020 and the subsequent recovery more sluggish as a result of soaring energy and food prices, the UK economy has started to make up some of the lost ground. This is reflected in the first estimate of real GDP growth for the first quarter of 2024, at 0.6%19. Investment is making a comeback in the UK, where there has been an acceleration in services, while pressure on prices is easing, although it remains too high. In line with consensus, we expect the BoE20 to make its first rate cut this summer, in early August, after the ECB but before the Fed.
China: growth at risk
China's real GDP growth of 5.3%21 year-on-year failed to impress the market much. In fact, it was more impacted by the fall in retail sales and industrial production in China at the end of the first quarter. Investors and economists do not seem to approve of the choice of stimulating growth through a supply shock. The government has chosen to fuel the economy by favouring the manufacturing sector through production subsidies, which has automatically encouraged the rebuilding of stocks. This has the advantage of supporting businesses and jobs, at least in the short term. However, this means finding outlets for these stocks, mainly outside China. Faced with the reluctance of Westerners, who are preparing or announcing tax increases on Chinese imports, this policy could put pressure on prices and GDP. This is compounded by a slowdown in domestic consumption, which is returning to normal after the Chinese New Year.
Having stabilised the job market throughs fiscal stimulus measures, the government intends to maintain its support for the property sector, which has suffered greatly. We therefore expect interest rate cuts to continue between now and the end of the year. Sales have already started to stabilise in some towns. However, much more will be needed to reassure households. Moreover businesses and investors remain concerned about the lack of a fixed and stable regulatory outlook.
The Fed and US elections: possible scenarios
The first US interest rate cut could come before the elections, in September or October, which is what the market is anticipating. There could also be another one after the elections, depending on the make-up of the two houses. If one of the parties wins a majority in both houses of Congress, this will leave the new President and his administration with plenty of room for manoeuvre when it comes to new fiscal stimulus, the priorities of which will differ depending on whether the Democrats or the Republicans have a majority. Their spending could boost inflation and convince the Fed to maintain its conservative stance.
Conversely, if Congress remains divided, the possible tax cuts sought by the Republicans, or the social spending planned by the Democrats, will be much more limited or even blocked. This could encourage the Fed to cut rates again.
The Long View
HY22: inexhaustible (out)performance or yet another show of exuberance?
The recent spectacular performance of the High Yield (HY) segment, particularly since the summer of 2022, is raising scepticism if not questions. Its so-called relative cost has been the subject of debate for months, but has not curbed the upward trend. What some investors believe to be the result of market exuberance continued to surprise in 2022, then in 2023 and now again in 2024. Mirova, for its part, has made its choice: in our view, there are compelling reasons behind these performances and they could even augur well for the future. So how did we come to this conclusion?
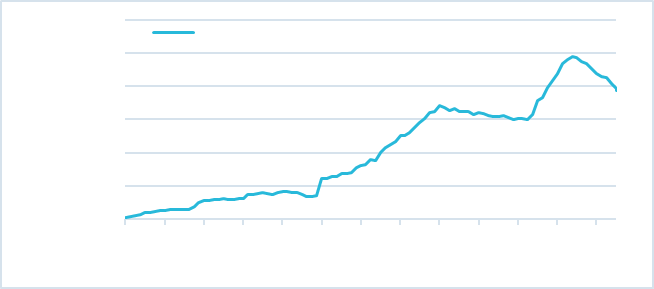
Firstly, the HE40 index has delivered an average annual performance of 5.3%23 since 1997. This puts the recent movements, which in historical terms are not so exceptional, into perspective. Holding HY is therefore part of a long-term strategy.
Equivalent annual yield of 5.3% since inception in 1997 and growing
Figures given refer to previous years. Past returns are not a reliable indicator of future returns
Annual yield - HE40 High Yield EUR BB-BS index
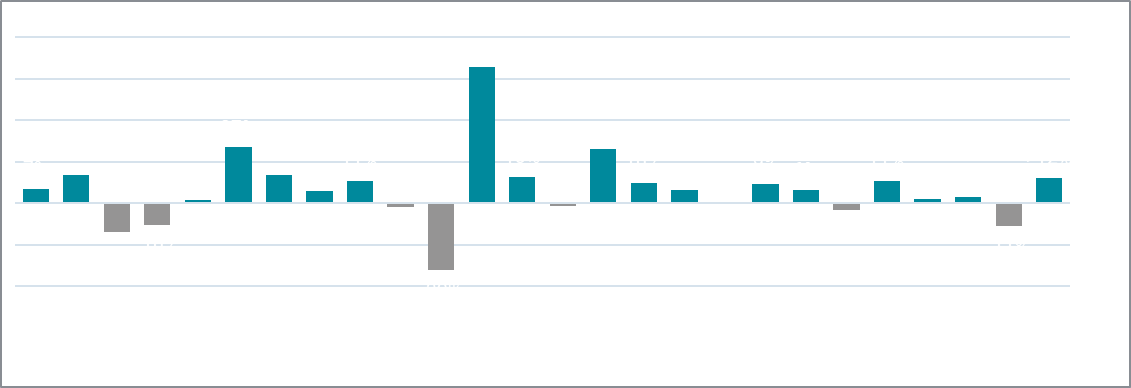
Source : Bloomberg, ICE 31/12/2023
3-year yield - HE40 High Yield EUR BB-Bs index
Source : Bloomberg ICE, 31/12/2023
Once there were too many bond issues, now there are too few!
Let's look at these three factors again:
Covid has side effects...
The Covid episode has had significant implications. Between the downgrades of Investment Grade (IG) issuers to HY and the flight to liquidity of all these issuers, including IG, HY indices had swelled, reaching a peak in 2021.
As we know today, companies borrowed more than they really needed. However, geopolitical events subsequently "closed" access to the primary market in 2022-2023 due to risk aversion. Add to this the low debt levels resulting from refinancing over the 2020-2021 period with maturities of 5-7 years at very favourable rates, a degree of flexibility in CapEx24 required after years of major investment, sluggish M&A in the absence of transforming acquisitions, and a significant number of rising stars25 and we had ideal conditions for a contraction in supply.
The hard / soft / no landing debat
Our regular readers will know that Mirova decided long ago in favour of a soft landing scenario, but the market has dithered, leading to questions about the prospects for interst rate rises, which initially clouded the perception of HY.
Many market players see rising interest rates, commodity prices, input costs - in short, inflation - as extremely negative catalysts for HY. This was also reflected in the record outflows in 2022. In our view, this approach is sometimes misleading for those who adopt it, at least at present, because HY can boast zero correlation with interest rates over long periods. Many issuers are agnostic to the effects of inflation, if they do not take advantage of it through price transmission mechanisms, because of their hyper-specialisation, or because they are very far up the value chain.
(Very) low historical correlation between HY and movements in sovereign interest rates
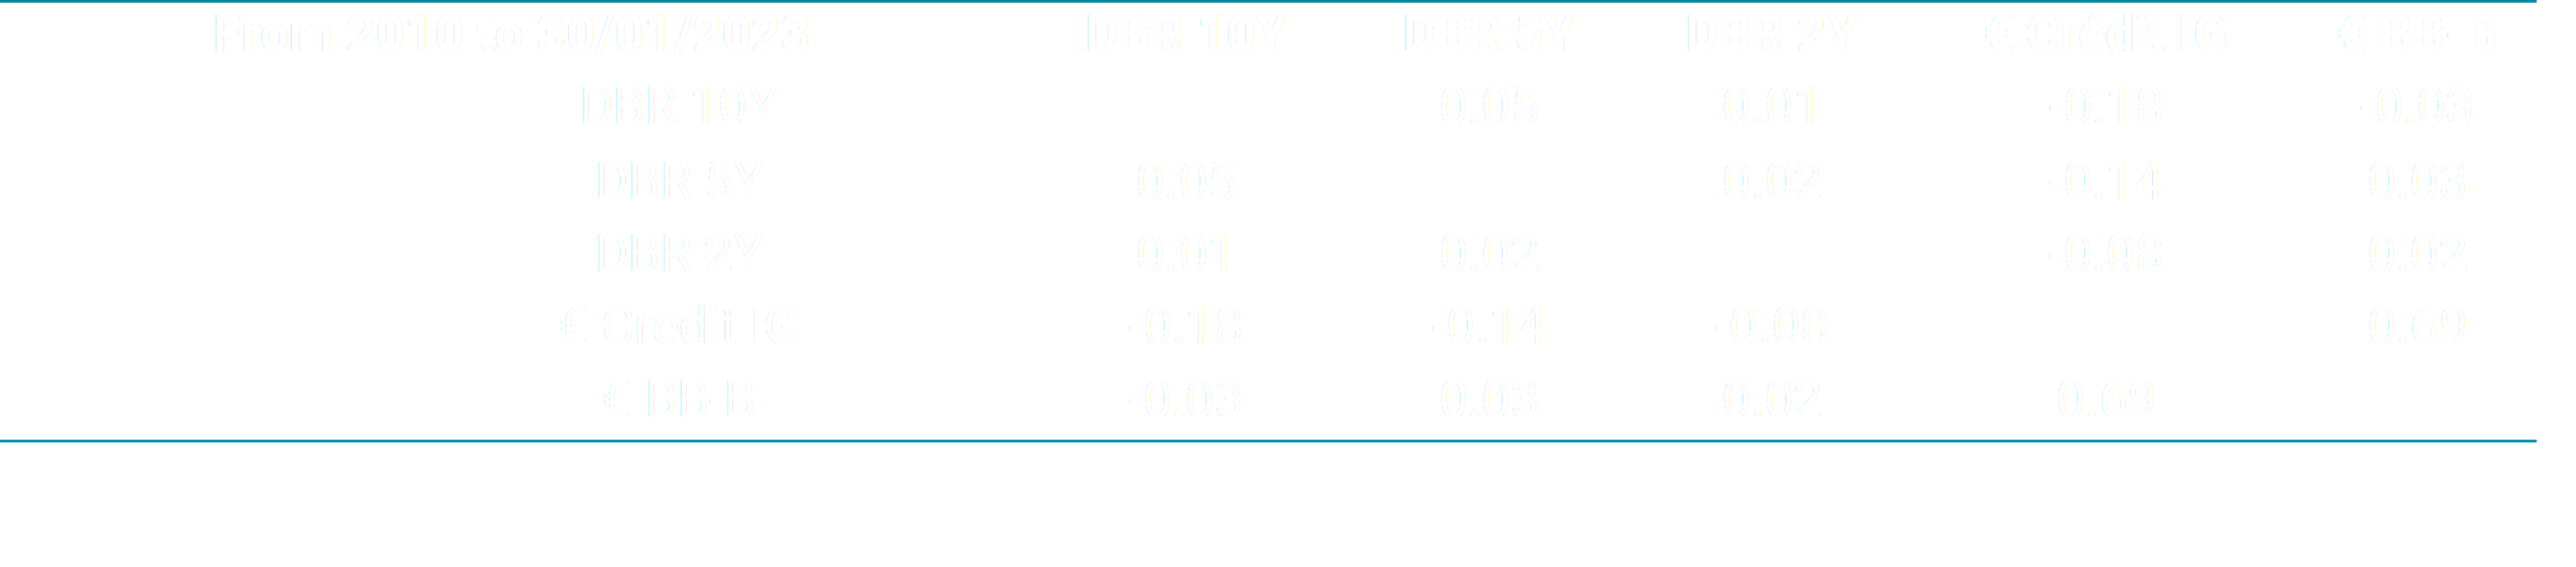
Sources: Bloomberg at 30/01/23, correlation matrix tool, "CORR", Mirova
The spectre of downgrading: who still believes in ghosts?
No company wants to see its rating downgraded at a time when risk-free rates are soaring. Historic HY companies have not escaped this rule, and neither have their shareholders, who have succeeded in demonstrating financial flexibility. In many cases, the amount of debt has been significantly reduced during refinancing exercises, through capital injections from sponsors, asset sales or the use of cash on the balance sheet, thereby significantly limiting the impact of rising interest rates, all in order to maintain ratings and contain financial costs. Many HY companies have also restricted their distribution policies and lowered their net leverage targets. More than ever, companies are motivated to adjust their financial policies in order to maintain or even improve them.
"He who matures early lives in anticipation"- Theodor W. Adorno
Technical effects like never before | HY has contracted by 21% in two years | The peak/off-peak variation could be as high as 40% if we got back to pre-COVID-19 levels
Sources : Bloomberg au 31/03/24, Mirova
All these factors contributed to record attrition in the asset class. Indices fell so much under these effects that they easily offset the outflow.
Net demand - issues - redemptions - net inflows - rising stars + fallen angels26- has exploded since 2022. As a result, the index has contracted by 21% since its peak in 2021. For information, if it were to return to its former levels (those of 2019), this would mean a further 20% reduction in the index.
Expensive on the surface, attractive deep below?
HY derives a large part of its expected return i) from its current yield (or coupons/interest), ii) from variations in its spread, iii) to a lesser extent, from risk-free rates and iv) from call structures, i.e. convexity. It is still common to see more than three redemption options, with different dates and prices. The closer the date, the higher the price for compensating investors.
It should also be pointed out that HY returns are measured "at worst", i.e. at the minimum level that investors can expect. All things being equal, it can only get better!
To sum up, any redemption that takes place earlier than expected, given that most bonds are currently trading below par (meaning that the market expects redemptions on average at maturity, i.e. as late as possible), considerably increases the yield in the current configuration. This is not at all the case for most asset classes, including IG and subordinated debt.
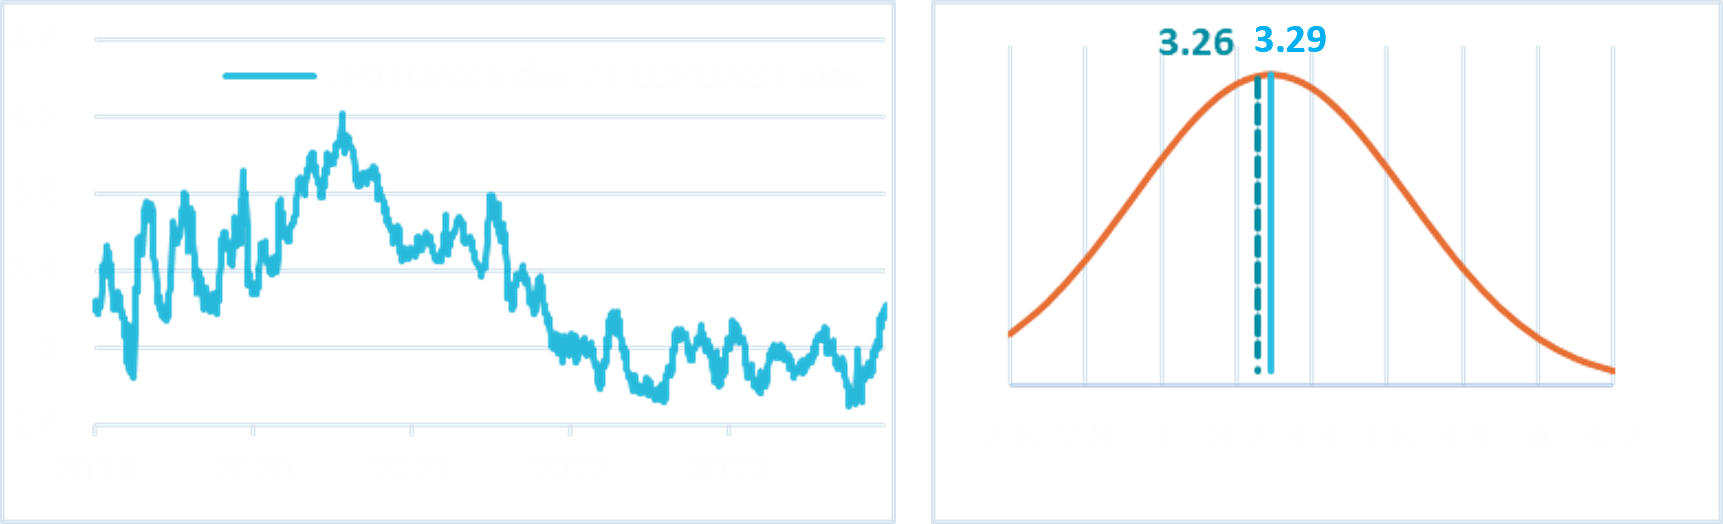
The latent potential of HY: call dynamics and convexity
Sources: Bloomberg at 31/03/24 on a sample of around 100 stocks, Mirova
If we correct spreads and yields for this effect, assuming premature redemption in one to three years, then HY, excluding subordinated bonds, can deliver up to 2.4% more yield than the worst-case yield. The effect is radical.

Sources: Bloomberg at 31/03/24 on a sample of around 100 stocks, Mirova
However, the fall in interest rates may make this assumption of early redemption more than plausible because, by increasing the price of bonds, it encourages issuers to refinance early. It should also be noted that single B issuers with a capital structure concentrated on one maturity are more than encouraged by the rating agencies to recall their bonds at least one year before maturity in order to avoid a downgrade to CCC on the liquidity factor.
Even as they stand, without recourse to these assumptions, HY spreads do not seem to us to be aberrant or extreme compared with other asset classes:
- multiples vs IG are at their median level of 3.3 ;
- CDS indices reflect a default rate of 1.9% in terms of number of issuers, in line with default rates over a sliding year.
Carry trade and absolute high yield have returned to the 5%+ level. At 3.3, the HY vs IG multiple is very close to the historical average/median
Sources: Bloomberg at 31/03/24, on the above-mentioned indices, "HS" tool, Mirova
Let's not forget that the Euro HY universe remains better rated than many observers seem to think, as they often overlook the strong preponderance of BBs and comprise more contractual 'subordinates', often issued by companies rated IG (A, AA at senior level) than they think. All this means that current spreads need to be put into perspective, and caution should be exercised when making historical comparisons. Today, HY is tending towards better quality than its historical average, and the market does not seem to have fully taken this into account.
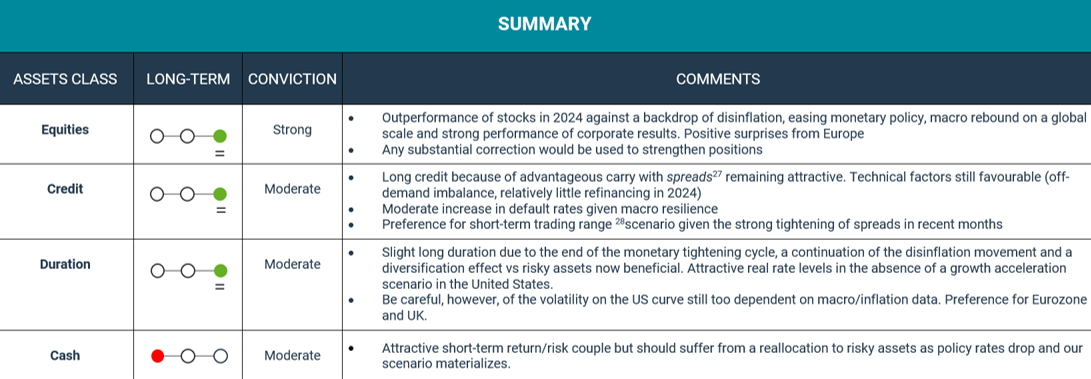
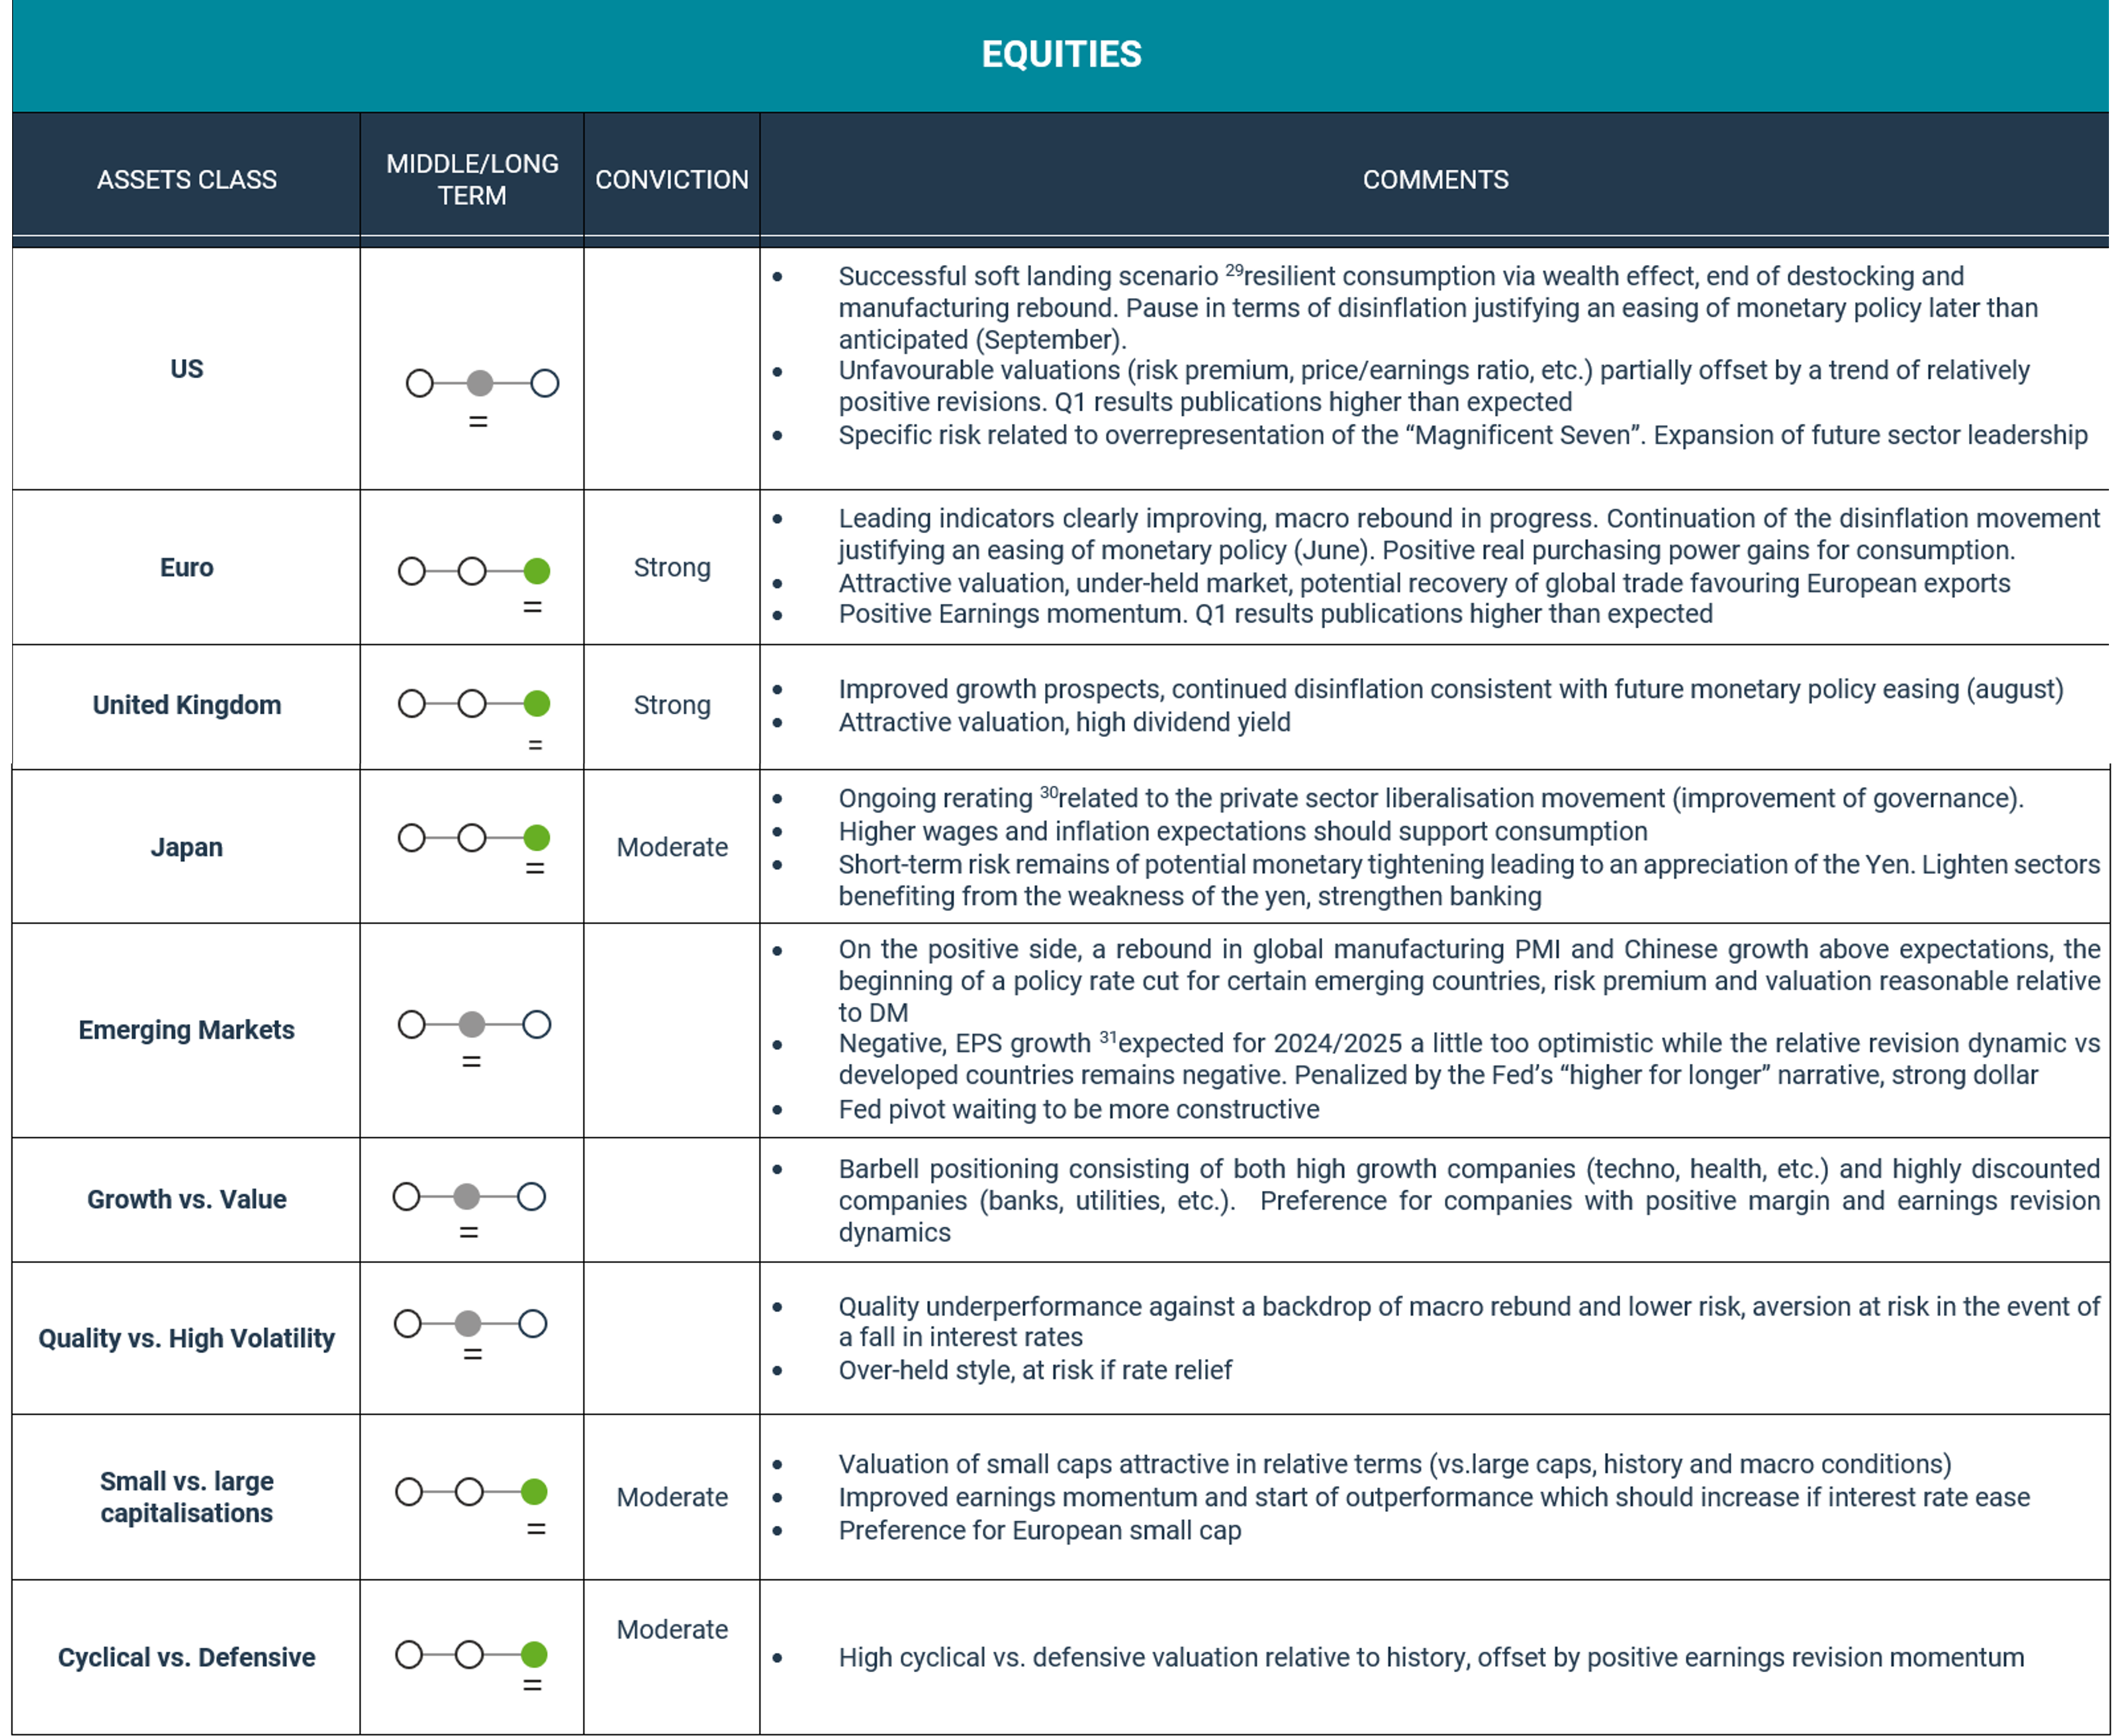
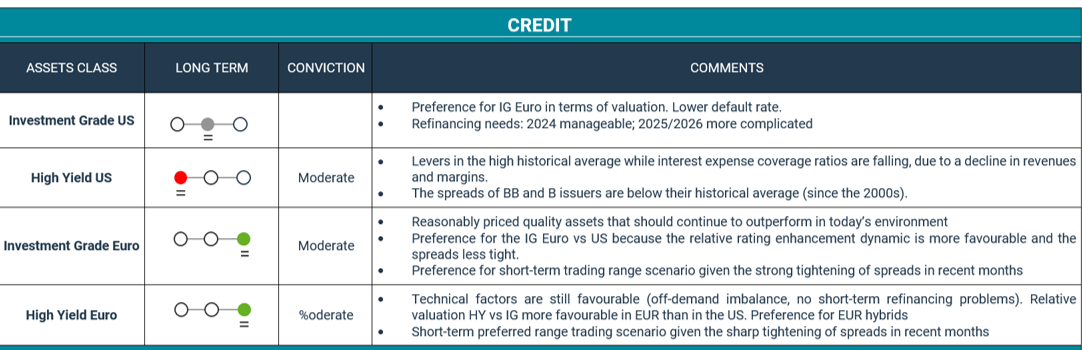
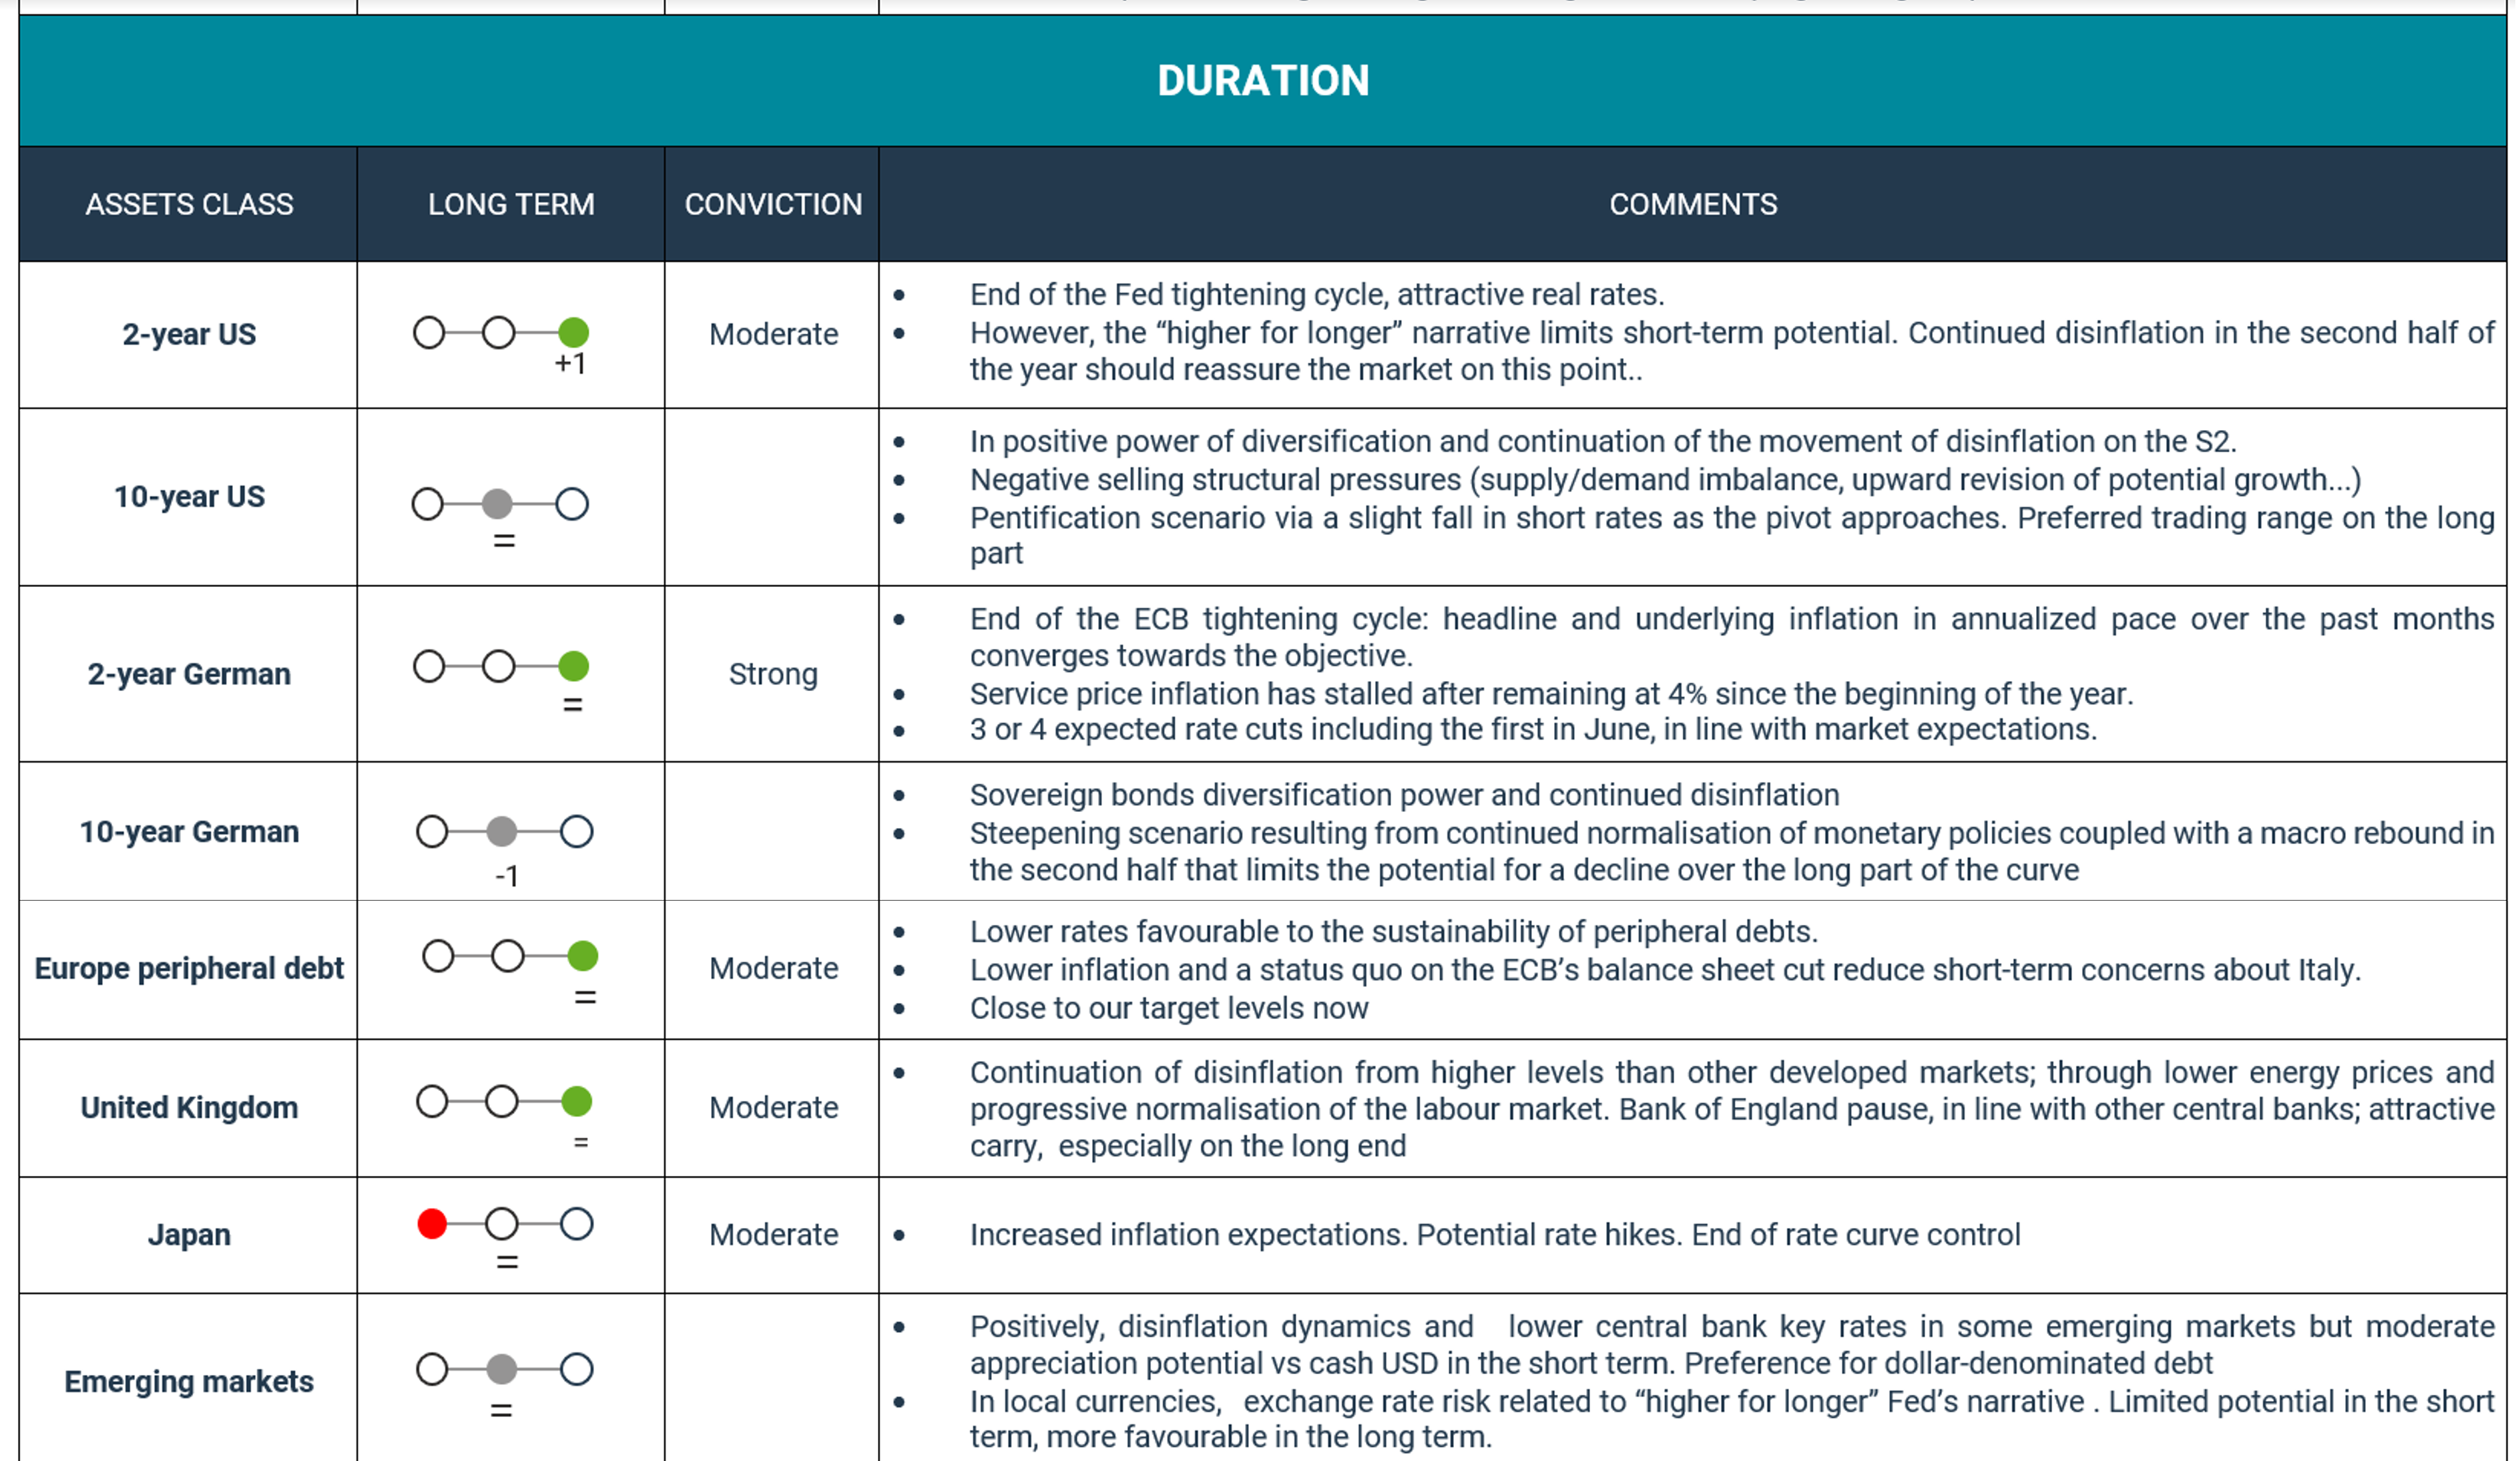
Summary
Market views